Find ideas. Follow changes. Understand what you own.
Explore Q-Score, valuation and charts across US & NSE stocks.
👆 Sign in to get started — it's free
Built on Yahoo Finance · SEC EDGAR · NSE · AMFI·Free plan, no card — see pricing
Stocks: discover, track, stay informed.
Illustrative examples, not live market or account data. Open a feature for real data.
01
Discover
Stock screener
Example screener · illustrative scores
Stock
Q-Score
Compare the full metric set in the screener.
02
Track
Your watchlist
Example watchlist · illustrative chart
Example price Q-Score
Price (INR)Q-Score
View chart data
Period
Price ₹
Q-Score
03
Stay informed
Alerts that matter
Illustrative alert · nothing sent
Example daily digestDEMO stock moved +5.2%
Example rule: a daily move of at least 5%.
01
Discover
Fund screener
Example funds · illustrative scores
Fund
MF-Score
Avg Q-Score
Compare funds and their underlying holdings.
02
Track
Your fund portfolio
Illustrative portfolio · not account data
Example current value₹3.27 lakhInvested ₹3.00 lakh Ring: invested allocation
3funds
Example gain ₹27,000 · 9.0%
Aurora Equity₹1,98,000
Horizon Flexi₹85,600
Cedar Index₹43,400
Import CAS or add holdings after signing in.
03
Measure quality
Look inside the fund
Aurora Equity · illustrative holdings
Fund-by-fund quality, not a return forecast.
Examples are not recommendations. Playback resumes after five seconds without interaction.
The dashboard
Every number that matters, on one screen
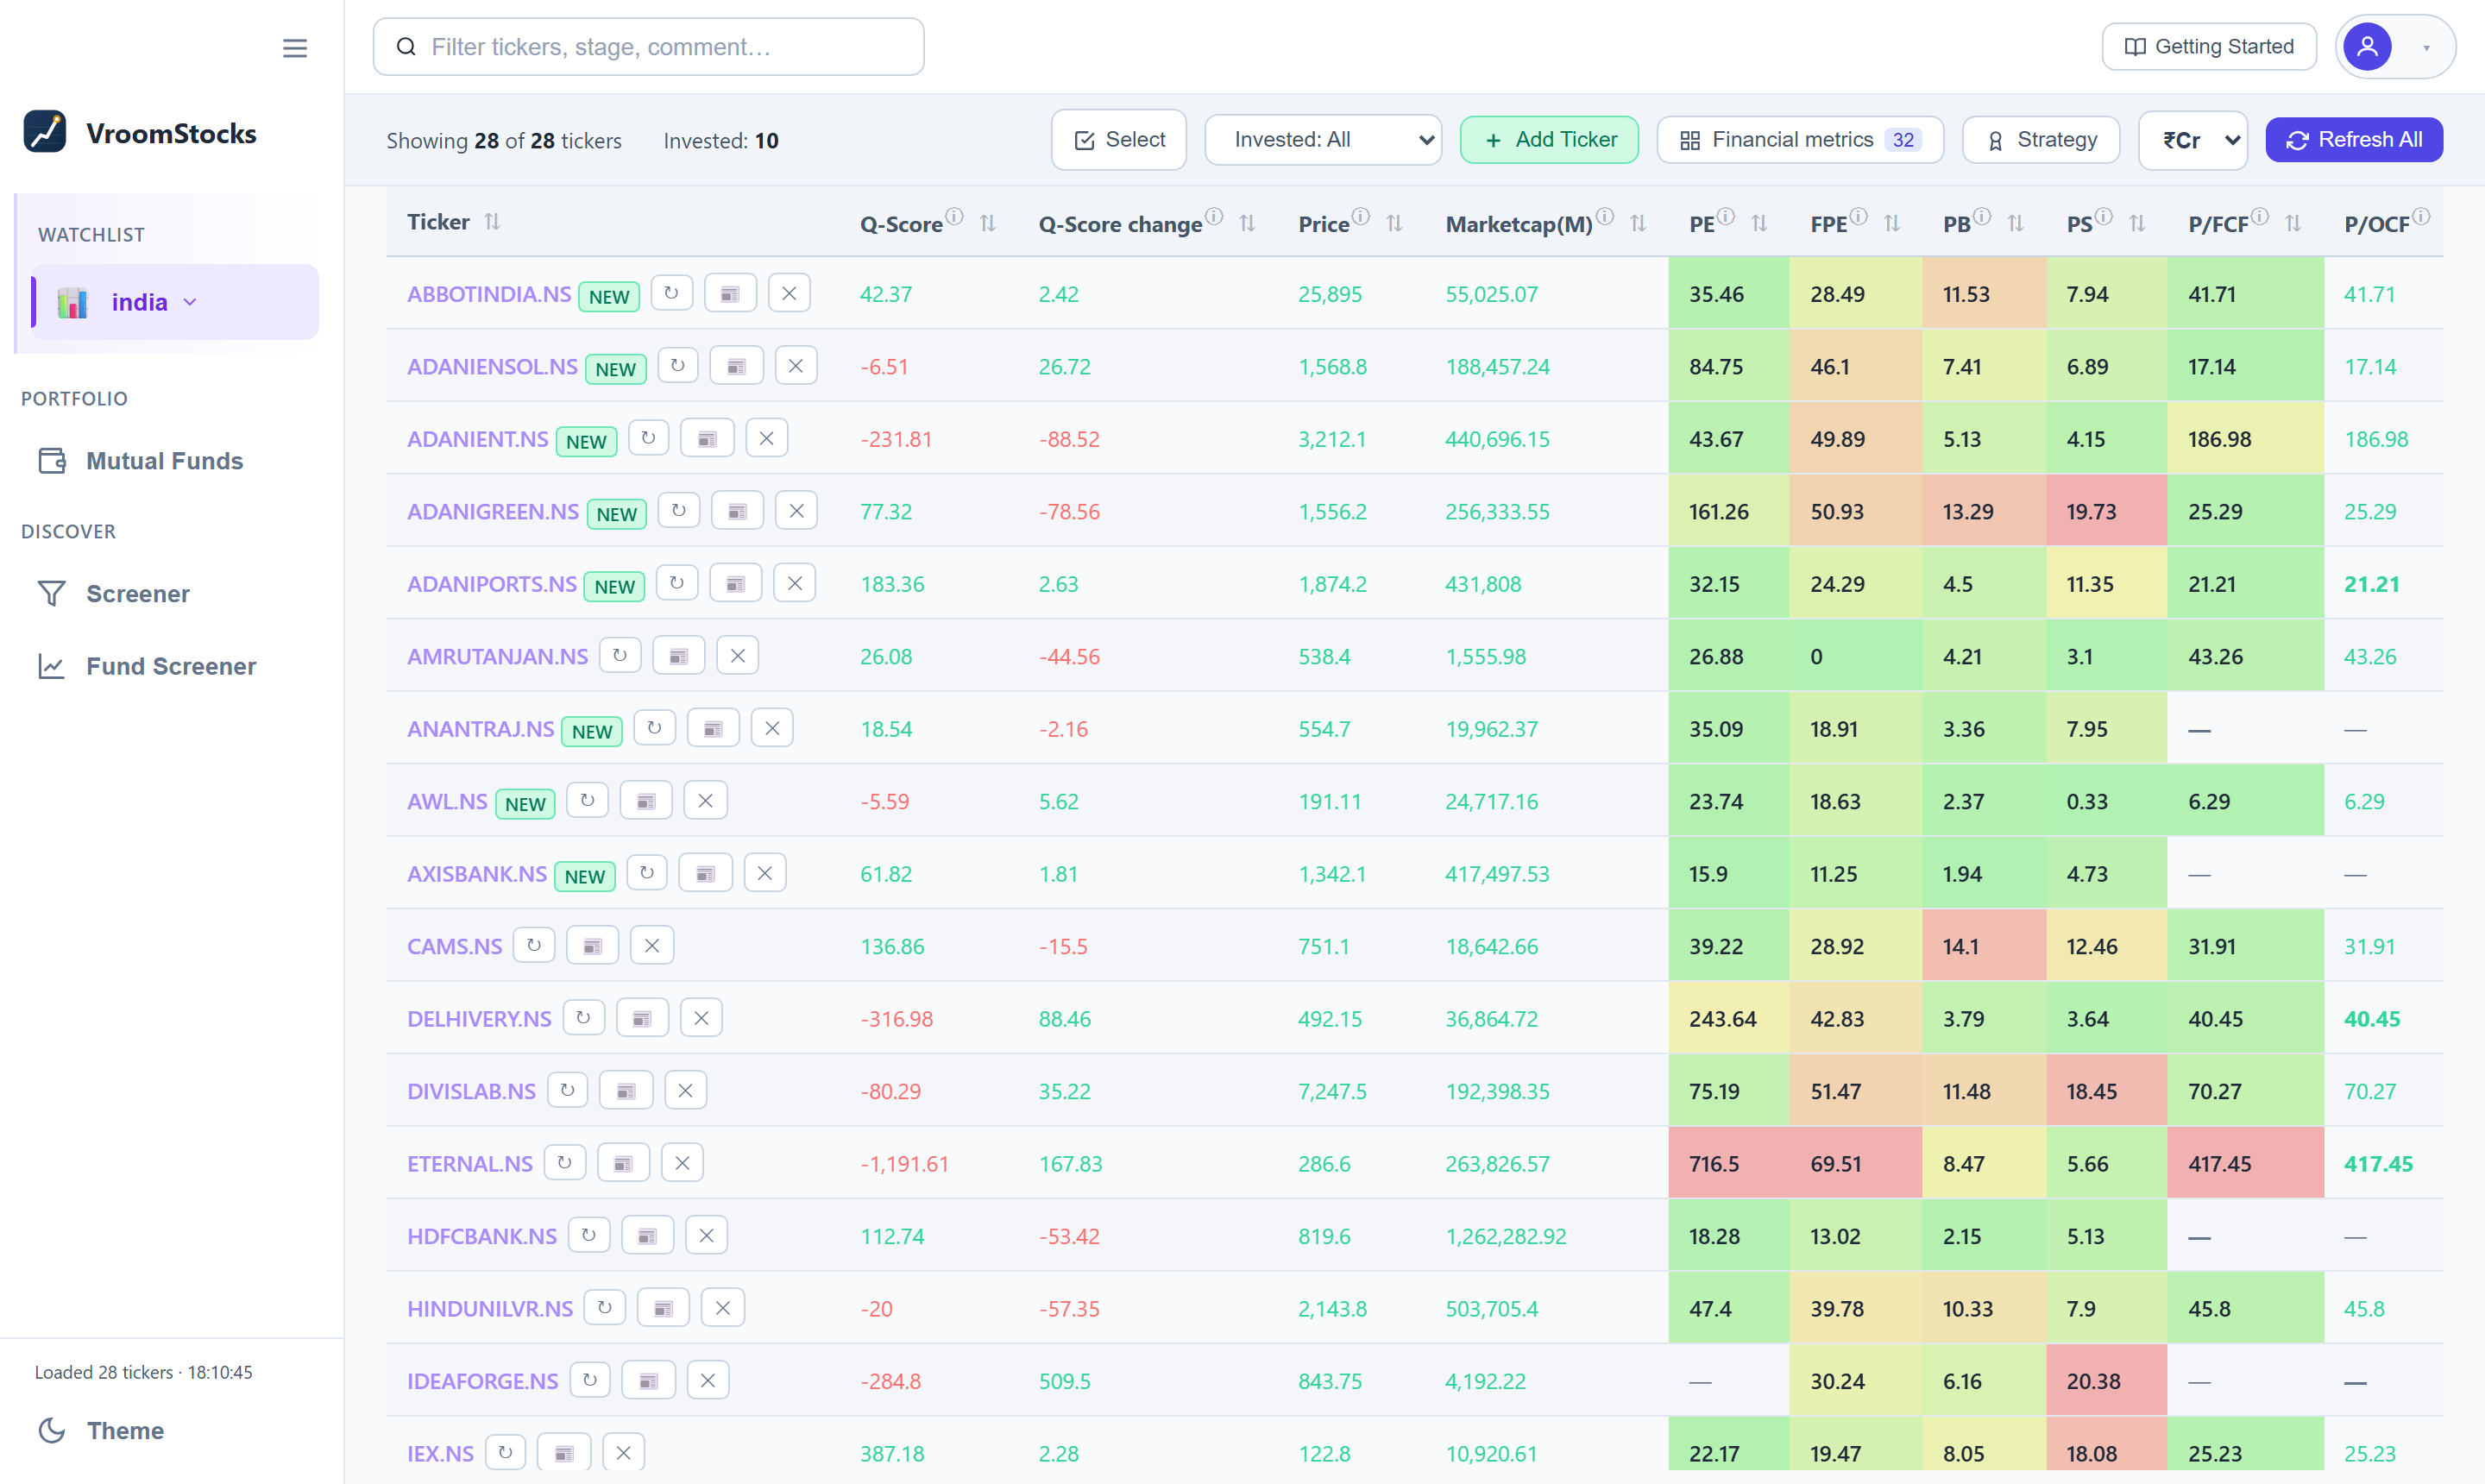
Your watchlist, scored and colour-coded — then one click into valuation, charts, AI summaries and backtests.
vroomstocks.com
0
Markets
0
Stock Metrics
0
Mutual Funds
0
Backtest Strategies
What's inside
Seven ways to find, understand and follow a company
Research, valuation, screening, simulation and alerts — no spreadsheets, and free to start.
Getting started
Up and running in three steps
1
Sign in
Google or email and password. Free, and no card is ever asked for.
2
Add your tickers
US or India. Your list, columns and settings sync across every device.
3
Analyse and act
Value, chart, screen and backtest — then track what you own, and let alerts tell you when it changes.
Ready when you are
The free plan is free forever — no card, no ads. Continue with Google, or use an email and password.
Built on primary data
Yahoo Finance · SEC EDGAR · NSE · AMFI
Free to start — no ads, no card
Private — your data is yours alone
Synced — settings follow you
Research and analysis only. VroomStocks never places trades and is not investment advice.
FAQs
Questions, answered
Is VroomStocks really free?
The Basic plan is free of charge, forever, and it covers the whole product — watchlists, valuation, charts, screeners, AI summaries, mutual funds, backtesting and screener alerts. Only the size of the numbers is capped: how many stocks you can track, how far back the financial history goes, how many AI summaries you can generate each month and which alerts you can set. Advanced raises every one of those. There are no ads, and nothing is charged unless you choose a paid plan.
Can VroomStocks tell me when something changes?
Yes — that is what Alerts are for. Set one on a buy/sell signal, a price move on your watchlist, a saved screen gaining or losing a name, a shareholding or insider transaction, a new earnings call or an AI summary, and it arrives by email hourly, daily, weekly or monthly. Everything due in the same window is combined into a single digest, and nothing is ever reported to you twice. The two screener alerts are included on the free plan.
Where does the data come from?
Prices and fundamentals come from Yahoo Finance, with SEC EDGAR and other public sources as fallbacks for US names and NSE for India. Mutual fund data comes from AMFI's official direct-growth catalogue. Earnings-call transcripts come from the exchange filings themselves.
Is my data private?
Every account gets its own isolated store. Your watchlist, holdings, screens and settings are scoped to your sign-in and are never shared with or visible to other users.
Do I need a broker account?
No. VroomStocks is a research and analysis tool — it never connects to a broker and never places an order. Backtesting and paper-trading are simulated on historical and live prices.
Which markets are covered?
US stocks (NYSE and Nasdaq) and Indian stocks (NSE), plus 2,500+ Indian direct-growth mutual funds. You can switch markets at any time from the sidebar.
Getting Started
An illustrated walkthrough of every feature — from adding your first stock to screening the market, reading AI summaries, tracking your mutual funds, backtesting a trading strategy and setting the alerts that tell you when something changes.
Toggle columns — click a chip to show/hide, click the group label to toggle the whole group
Add Ticker
WATCHLIST
Keep in view
Send Feedback
Your next step
Keep the ideas worth coming back to.
Sign in to save your research across devices.
Save your favourite screens
Build a watchlist of your own
Pick up where you left off
Browsing stays free. No account required.
Are you sure?
Name this
Open
Add it to the companies you're comparing on Visual, or open its full Analysis page.
Save as template
Name this metric selection so you can pick it again from the Template list.
Create New Template
Metrics
Categories
News
Recent announcements
Watchlist — one row per stock. Column headers are sortable: press Enter or Space on a header to sort by it.
No matching stocks found.
💰 Click any ticker to open its full valuation breakdown
No matching stocks found.
📊 Click any ticker to open its detailed charts
Ticker
📈 Click any ticker to open its technical charts
Ticker
⛓️ Click any ticker to open its options charts
Ticker
✨ Click any ticker for AI summaries of its concall, valuation, fundamentals, technicals and options
Ticker
🧪 Click any ticker to backtest popular trading strategies over the last 5 years
Ticker
📈 Configure trading strategies on a ticker and track their paper-trade performance forward from the day you add them.
Strategy Analytics
Which of the 10 backtest strategies wins most consistently — across your whole portfolio, and against the broad market.
No analysis yet for this region. Run it once to see which strategy performs best across your portfolio and vs the market. This fetches 5 years of history for every stock you track, so it may take a little while — after that, it loads instantly from your saved results until you hit Refresh again.
Fetching 5-year history and simulating 9 strategies…
Your Portfolio — Strategy Ranking
Per-stock CAGR by strategy — scan a column for the greenest strategy
Index Benchmarks
Loading screener results…
No stocks match this screener.
How to use this screener
Start from an index rather than from your own list: filter its members on 45 metrics, sort by anything, and save the searches you want to run again.
How it fits together
Pick a market and an index, set your filters, then add any of the 45 available metrics as columns. Q-Score plus every filtered metric stay locked in place; everything else is yours to arrange. Each column sorts, and blanks always sink to the bottom rather than crowding the top.
From screen to analysis
Any result opens straight into the full stock page — valuation, fundamentals, technicals, options and AI summaries — so a screen is a starting point rather than a dead end.
Loading fund screener results…
No funds match this screener.
How to use this screener
Screen the Indian mutual fund universe on returns, cost and risk — then open any fund to see exactly what it owns.
Screen on what matters
Filter and sort on returns over multiple horizons, expense ratio, category and fund house. As with the stock screener, the metrics you filter on are pinned into the table, and every column — including the fund name — sorts.
Then check the overlap
Holdings-level detail is what turns a shortlist into a decision: three well-rated funds that hold the same twenty companies give you far less diversification than their labels suggest.
Period: Specific Period — set the From Date year to 1990 (e.g. 01-Jan-1990) to capture all history, and To Date today.
Folio Listing: Transacted folios and folios with balance.
Enter your email, then set the statement password (and confirm it) to your PAN number.
Submit — CAMS emails the password-protected PDF. Upload that file below and enter your PAN as the password.
The CAMS request form with the settings above highlighted — tap the image to open it full size.
Everything is parsed on the server — the file is never stored.
Add a holding
Charts
Add ticker
Workspace library
Choose a starting template, then choose a template for each ticker below.
Chart templates
Your next chart starts with a ticker
Use + to add a ticker. Adding a chart won't change your watchlist.
Chart options
Data export options
Only loaded rows are exported. Blank bounds include all loaded times.
Drawing tools
Visual
Choose metrics — each one is drawn as its own chart, with a line per company
Loading financials…
Financial metrics
Alerts
Get an email when something you follow actually moves.
Everything due in the same window arrives as one message, so more alerts
does not mean more email.
Profile
Your details and how you sign in. Nothing here is shown to anyone else.
Your details
Password
You sign in with Google, so there is no password stored here. Change it in your Google account.
Admin
Warm and refresh the shared screener and transcript caches, and schedule them to keep themselves up to date.
Sections
Screener universe
Market
Universe
Loaded
Last updated
Actions
Warm fetches only the stocks that are missing or stale. Refresh force-re-fetches every stock in that universe (slow for “All”). Warm missing (under a market) warms every not-fully-loaded universe in that market at once. The job now retries throttled fetches and only gives up on genuinely un-fetchable symbols (shown below). One job runs at a time. The auto-refresh cadence below force-refreshes the whole universe server-side on a schedule, even when no one is on the page.
User analytics
Users, stocks added, app installs, and activity across the selected window. Activity is logged from this feature's deploy onward; stock counts and “last active” also reflect earlier data.
User
Stocks added
Added in window
Activity in window
Top actions
Last active
Top 10 anonymous IPs by visits
Uses the time window above: rolling 24 hours, 7 days, 30 days or 365 days. Counts recorded visits, not unique people; shared networks and VPNs can share an IP. Locations are approximate and use the latest known location recorded in that window. Known bots and visits without an IP are excluded.
IP address
Location
Visits
Last visit
Activity log
Every row recorded in activity_log, newest first. Filters and paging are applied on the server, so they search the whole table rather than the rows on screen.
ID
Time (UTC)
User
Action
Detail
Region
Location
IP
Device
Browser
Reliability & performance
How the APIs readers actually call are behaving, and how the background sync jobs are doing. A failure is a 5xx or an unhandled exception — a 4xx is counted separately as a client error, so an endpoint that validates its input does not look broken. Reliability is (calls − failures) / calls. API timings are recorded into hourly buckets and flushed every minute, so the last minute may be missing.
FlaskApp CPU & memory capacity
Azure Monitor for investwithai, last 30 days through the last completed hour. Times are UTC; weeks start Monday. This history is independent of the API/job window above.
Percentage of available capacity used on FlaskApp's hosting plan, including all apps and platform usage on that plan. CPU and memory show averages of available hourly percentages; memory also shows the highest reported peak. Azure combines plan instances. Missing samples stay blank, not zero. Results are cached for up to 5 minutes.
CPU capacity used (%)
Memory capacity used (%)
View metric data and coverage
FlaskApp hosting plan CPU and memory percentages over the last 30 days. Missing values are shown as unavailable.
Period (UTC)
Avg CPU (%)
Avg memory (%)
Peak memory (%)
Hours: CPU / avg / peak / expected
SyncApp CPU & memory capacity
Azure Monitor for investwithai-sync, last 30 days through the last completed hour. Times are UTC; weeks start Monday. This history is independent of the API/job window above.
Percentage of available capacity used on SyncApp's hosting plan, including all apps and platform usage on that plan. CPU and memory show averages of available hourly percentages; memory also shows the highest reported peak. Azure combines plan instances. Missing samples stay blank, not zero. Results are cached for up to 5 minutes.
CPU capacity used (%)
Memory capacity used (%)
View metric data and coverage
SyncApp hosting plan CPU and memory percentages over the last 30 days. Missing values are shown as unavailable.
Period (UTC)
Avg CPU (%)
Avg memory (%)
Peak memory (%)
Hours: CPU / avg / peak / expected
APIs
Top 10 failing APIs
Ordered by number of failures. Select a row to see why it failed.
API
Method
Calls
Failures
Client errors
Reliability
Why
Top 10 slowest APIs
Ordered by average server time, not by the worst single call — one cold start is not a slow endpoint.
API
Method
Calls
Avg
Slowest
Reliability
Reliability by API
Every endpoint called in this window, least reliable first.
API
Method
Calls
Failures
Client errors
Avg
Reliability
Sync jobs
Sync job failures
Failed and partial runs with their message. A run that merely had failing tasks carries its reasons on the tasks, so those are shown underneath.
Job
Outcome
When
Took
Failed tasks
Message
Sync job performance
Job
Runs
Avg
Longest
Tasks done
Tasks failed
Sync run reliability
A partial run counts against reliability; a cancelled one does not — a deploy stops the worker mid-run by design, and counting that would track how often we ship rather than how well the jobs work.
Job
Runs judged
Succeeded
Partial
Failed
Cancelled
Reliability
Fund Screener universe (India)
Warm and refresh the shared mutual-fund universe (AMFI Direct-Growth schemes, NAV history via mfapi.in). Warm fetches only missing or stale funds; Refresh re-fetches every fund in that category (slow for “All”). The auto-refresh cadence below warms every category on a schedule, server-side, even when no one is on the page. One fund job runs at a time.
Category
Loaded
Last updated
Actions
Q-Score recompute
A stock's Q-Score is recalculated every time that stock is refreshed, but a fund's Avg Q-Score is a stored holding-weighted average of its constituents' scores, so nothing recomputes it on its own — this job does. It sweeps the whole cached universe, oldest-scored scheme first, and also refreshes Avg Technical Upside% and Avg Analyst Upside% alongside it. It costs one fund-detail request per scheme, so it is scheduled separately from the warm above; weekly is the sensible cadence. It also snapshots each fund's holdings and descriptive info, which the Fund Detail page then serves from this cache instead of calling Groww itself. Recompute now runs the same sweep immediately.
Earnings call transcripts
Pre-fetch earnings-call transcripts for every stock in the covered indexes (membership read from the index_constituents table) into the shared earning_call store, so the Earnings Call page answers from the database instead of waiting on a provider. Sync due checks each ticker's next earnings date (cached, refreshed about once a quarter) and only fetches the ones that have reported since we last stored a report — the cheapest pass, and what the schedule runs; Sync new re-checks every ticker and stores only reports that became newly available since its last sync; Prefetch skips tickers fetched in the last 30 days; Refresh all re-fetches everything (slow). The auto-refresh cadence below runs Sync due on a schedule. One job runs at a time; each run's synced reports are listed under Recent syncs. Only the 4 most recent reports are kept per company — storing a newer one evicts the oldest.
Reads primary regulatory documents straight from the source — no model, no vendor, no API key. United States (SEC EDGAR):XBRL financials parse each 10-Q/10-K's tagged facts into sec_xbrl_financials (the source behind the Financials page, including the revenue/segment breakdowns); Form 4 records every insider trade into sec_form4, distinguishing an open-market purchase from a vest or a tax withholding; 13F-HR records what a curated set of active institutional managers holds, into sec_thirteenf. India (NSE/BSE): the exchange's XBRL result filings land in the same financials table, PIT insider disclosures are India's Form 4 analogue and share sec_form4, and the quarterly shareholding pattern — an issuer-side promoter / public / employee-trust split rather than a per-manager holdings list — lands in nse_shareholding. Only 13F is US-only: it has no Indian equivalent, and India's shareholding pattern has no US one.
Full sync seeds a market from scratch — a year of Form 4 / PIT history per ticker, two quarters per 13F manager, and as much XBRL history as that market's XBRL history selector asks for (1–10 years, or everything the source still serves) — and takes hours. Deeper history costs proportionally more time: each company files four periodic reports a year and every one is parsed individually, so ten years is roughly three times the work of the three-year default. Incremental sync is exactly what the schedule runs, and only asks for what can have changed: XBRL takes each company's newest filing (the history selector does not apply), Form 4 pulls the market-wide filing index for the last few days (one request for the whole universe, not one per ticker), and quarterly holdings do nothing at all outside their filing window, because a book is frozen between deadlines. Recommended cadence: daily. An insider must file within two business days of trading, so anything slower reports the news late; XBRL lands with the periodic report a median of one day after the earnings release; and the 13F window opens itself four times a year (14 Feb · 15 May · 14 Aug · 14 Nov) without costing anything on the other ~300 days.
Dataset
Stored
Companies
Latest
Incremental strategy
United StatesSEC EDGAR — XBRL · Form 4 · 13F
Also sync
These checkboxes control the scheduled US run only — the ones beside the manual sync buttons below are separate. XBRL always runs and has no checkbox: this pass is the only thing that syncs structured financials — nothing else pulls a company's 10-Q/10-K — so switching it off would stop the Financials page updating entirely. Datasets run in order (XBRL → Form 4 → 13F) and each waits for the one before it.
These checkboxes control the scheduled India run only. XBRL always runs and has no checkbox, for the same reason as the US group. The two India boxes are separate documents: PIT insider disclosures are the Form 4 analogue (individual trades), while the shareholding pattern is the issuer's quarterly promoter / public / employee-trust split — it travels on the same dataset slot as 13F because it answers the same "who owns this" question, so switching it off leaves ownership stale even though insider trades keep flowing.
Datasets (manual run)
One filings job runs at a time across both markets, so starting either group's sync disables the other's Start buttons until it finishes, and this Cancel stops whichever is running.
Stocks table refresh
Keep the per-user stocks watchlist rows up to date server-side, even for tickers nobody has opened. A ticker is due when it has never been fetched, when it was last fetched on or before the company's latest earnings report (so the stored numbers predate results that already exist), or when it was last fetched more than 90 days ago. Report dates come from the earnings calendar the transcript sync already maintains. Refresh due fetches only those; Refresh all re-fetches every ticker (slow). Each ticker is fetched once and merged into every user's row that holds it. The auto-refresh cadence below runs Refresh due on a schedule. One job runs at a time.
Data integrity — XBRL coverage
How completely the structured filings store (sec_xbrl_financials) is populated, per metric and per region. The Financials page renders only what was stored, so a line item the extractor never populates is invisible — it simply does not appear, which reads as “the company does not report this” rather than as a gap. A metric at or near 0% filled is therefore a mapping bug, not a disclosure fact, and this is the only place it shows up. Percentages are of that region's own row count, so the two columns are comparable in share but not in absolute rows. Click any column heading to sort.
Quarter coverage — how many quarters each stock is missing
The section above asks whether a stored row is filled; this one asks whether the row exists at all. Every stored filing is folded onto the calendar quarter its period ends in — a 10-Q, an Indian quarterly result and a 10-K all land on a quarter boundary, and a 10-K's period end is its fiscal Q4 end, which is exactly the column the Financials page derives Q4 from — so this counts renderable quarters, not filings. The window ends at the newest quarter that market has actually reached, not at today, because a quarter that is simply not reported yet is not a gap. Each absence is then split by why it is absent: quarters before the stock's first filing, quarters still inside ordinary filing lag and quarters a delisted stock will never file are facts about the company, while a hole with filings on both sides — or a live index member that has fallen behind — is ours. Only the last two are worth chasing, and the Real gaps column counts only those.
External data sources
Every third-party feed the app depends on, grouped by the functionality it serves, with whether its credential is actually set on this instance. Keyless is a deliberate design choice throughout — the exchange and regulator feeds need no account — so it is a healthy state, not a gap. Not configured means that source is currently unavailable and whatever depends on it is running on its fallback.
API reference
Every HTTP endpoint this app exposes, with what it is for and a worked request and response. The list is discovered from the running app's own routing table, not hand-maintained, so it cannot fall behind the code — a route added tomorrow appears here on the next load, marked undocumented until its entry is written in api_catalog.API_DOCS. Samples are illustrative literals: opening this page makes no upstream call and reads no user data.
Sync queue & run history
Every background job now runs in a separate worker process, not inside the web app. A card's “Run now” only puts a run on the queue; the worker claims it, splits it into units of work and records each one. That is what makes a sync survive a deploy: whatever was mid-flight simply loses its lease and is picked up again, rather than vanishing with the process that was running it.
Each unit keeps its own attempt count, backoff and last error, so a failure is recorded rather than retried invisibly. A run that finished with some units still failing is marked partial — expand it to see exactly which ones and why, then retry just those. Only one run per job is ever in flight; that is enforced by the database, not by this page.
Alerts — daily summary by type
The four digest jobs are ordinary queue jobs, but they run as often as hourly, so the history above leaves them out by default — tick “Include alert digests” there to see the individual runs. This is the part the run rows cannot tell you anyway: what went out each day, by alert type, and what failed. A run that succeeded having found nothing is normal and common — only the sends table distinguishes it from one that mailed hundreds of findings.
Alerts summary
Two questions about alerting, answered side by side: how many alerts we have actually sent, by type and by frequency, and how many readers have configured each type and frequency. Sends are counted from a ledger written at the moment an email goes out, so an alert someone has since edited or deleted is still counted — the configuration table alone could not tell you it ever fired.
A finding is one thing worth reporting; a digest is one email, which may carry several. Rules and readers are counted separately on purpose: one reader with twelve price alerts is a very different signal from twelve readers with one each.
Sync settings
Configure background job timing and throughput. Changes are stored in SQL; workers pick up most settings within a minute. Each field explains any delayed effect. Filings leases apply to newly claimed runs, not existing claims or running workers. Default shows the value restored by Reset. Values are range-checked.
AI settings
The Azure AI Foundry wiring behind AI Insight and the earnings-call metrics, plus every prompt the models are given. An edit is stored in SQL and applied immediately — the other worker picks it up within a minute. Default is the App Service app setting (or the built-in value) the app started with, so Reset always restores it. The API key is write-only: once saved it is never sent back to this page.
Prompts
These are sent verbatim to the model. The system prompt is what forbids outside knowledge, buy/sell calls and price targets, and what tells the model to treat stock data as untrusted input — weakening it weakens those guarantees. Existing summaries are cached and are not regenerated by an edit; use a card's ↻ Refresh to rewrite one. For the extraction prompts, bump the prompt version so stored metrics are re-extracted.
Data config — Q-Score scoring anchors
The Q-Score puts every input on the same 0–100 scale before comparing them. Each metric gets a straight line between a low anchor, which scores 0, and a high anchor, which scores 100; anything beyond either end is clamped. The quality metrics are averaged into the Q-Green-Score, the valuation multiples into the Q-Black-Score, and Q-Score = Q-Green-Score − Q-Black-Score, so it always lands between −100 and +100.
The anchors are absolute, not peer-relative, on purpose: a score has to mean the same thing in every watchlist, and a percentile against neighbours would move a stock's score when the neighbours change. Widening a range makes that metric less decisive; narrowing it makes it more. A multiple that is missing because the company loses money is scored at the maximum expensive end rather than skipped, which is what stops losses from flattering a score. Edits are stored in SQL and apply within a minute on every worker; they do not rewrite already-stored scores — those refresh as each stock does.
Plan settings — what Basic and Advanced include
Every number the two plans differ on: watchlist size and count, years of financial history, saved visuals, the two monthly AI allowances, how many alerts of each type a reader may create, the price and the free trial. Advanced is any admin — the owner or a delegated address — plus anyone with a live paid subscription (see Billing), and everyone else is Basic. So this card configures what each tier gets, not who is in it.
Edits are stored in SQL and apply within a minute on every worker, including the out-of-process sync worker. The same numbers are served to the public pricing cards through /api/plans, so a change here moves the marketing copy as well — which is the point: hand-written copy drifts from the cap the server enforces. Stocks treats 0 as unlimited; each Alerts: field is a per-kind cap where 0 means that alert type is not on the tier at all. ⚠ Watchlists is advertised but not yet enforced — there is no per-user watchlist cap. Prices are in INR. ⚠ Changing a price here does not change what an existing mandate debits — a provider plan’s amount is immutable, so mint a new one from the Billing card afterwards.
Connects the Advanced plan to a UPI Autopay aggregator — Cashfree (default) or Razorpay — so a customer can start it themselves: one UPI scan debits the trial charge immediately and registers an Autopay mandate that collects the Advanced price from day 8 onward. Until Accept payments is on and the selected provider’s credentials are set, the pricing card keeps its “Contact Us” button and /api/billing/subscribe refuses with 503 — so a half-configured install cannot take money. Each provider’s keys are stored separately, so switching back and forth loses nothing.
⚠ A secret is never shown again once saved — only whether one is set. The webhook signature is the security boundary of the whole feature: entitlement is granted only by a callback whose HMAC verifies, never by the browser. Cashfree issues no separate webhook secret — it signs with the key secret above, so leave that field blank; Razorpay does issue one and needs it filled in. Point the provider at /api/billing/webhook/cashfree and subscribe it to its subscription events. Create plan appears only for Razorpay, whose plan amounts cannot be edited — mint a new plan after any price change or customers keep paying the old one. Cashfree sends the price inline with every subscription, so it needs no plan step and cannot drift.
⚠ Test connection before switching payments on. It creates a real subscription in the provider’s sandbox with the stored keys, resolves the authorisation link and cancels it again — which is the only way to tell a key that is set from a key that is right. It refuses while Live mode is on, because against a live account it would register a genuine mandate.
Subscribers
Admin management
Delegate the admin console to another address, and raise a single user's AI allowance above the plan default. Both lists are stored in SQL and picked up by every worker within a minute.
Admins
An address here gets the whole admin console — every sync job, every user's analytics and every setting on this page. Grant it sparingly. The owner is compiled into the app rather than stored as a row, so it can never be removed and no database edit can lock it out; for the same reason, only the owner can grant or revoke admin — a delegated admin that could delegate further would let one compromised account entrench itself. Delegated admins see this list but cannot change it.
AI limits by email
Overrides for one address. Daily is the anti-burst ceiling on generations per UTC day; Summaries and Insights are the monthly plan caps for earnings-call summaries and the four insight kinds. Leave a box blank to keep that bucket on the default. Admins are already exempt from the monthly caps, so this is for normal users. Any admin can set these — it moves a spend cap, not access.
dailysummariesinsights
Test
One-off checks that touch the real outside world. Use them to verify a template or a provider end-to-end without creating an account.
Welcome email
Sends the onboarding email — the same one a new user gets after verifying their address (email/password) or on their first page load (Google sign-in) — to any address you type here. This is a real send through Resend, and it deliberately does not touch the send-once ledger: testing against an address never uses up that person's actual welcome email, and you can repeat it as often as you like. Preview renders the same HTML in a new tab without sending anything.
Analyse a stock
Search for any listed company to open its analysis page.
Price: —Sector: —Industry: —
Key metrics
Price Chart with Moving Averages
History window
Scroll to zoom, drag to slide along the dates (shift + scroll also slides). On a phone, pinch to zoom and swipe to slide. Double-click to reset.
🎙️ Latest earnings call
✨ AI insights
📣 Recent announcements
📰 In the news
Financials
Period basis
0 metrics selected
Period:
Compare:
Loading financial data…
Income Statement Breakdown (TTM)
Loading financial data…
Revenue to Profit Conversion (TTM)
Gross Profit Margin % — Quarterly
Operating Profit Margin % — Quarterly
Debt to Equity Ratio — Quarterly
Return on Equity & Invested Capital — Quarterly
Insider Trading Activity (Last 12 Months)
Institutional Holders
Top Holdings
% of shares outstanding
SEC 13F
SEC 13F filings · reported position value
Insider Transactions — SEC Form 4
Shareholding Pattern — NSE
Dividends & Buybacks — Quarterly
Revenue Growth % (YoY) — Quarterly
EPS Growth % (YoY) — Quarterly
Earnings — EPS Actual vs Estimate
Ownership Breakdown
Seasonality — 5-Year Yearly Overlay
Valuation Matrix
Loading price history…
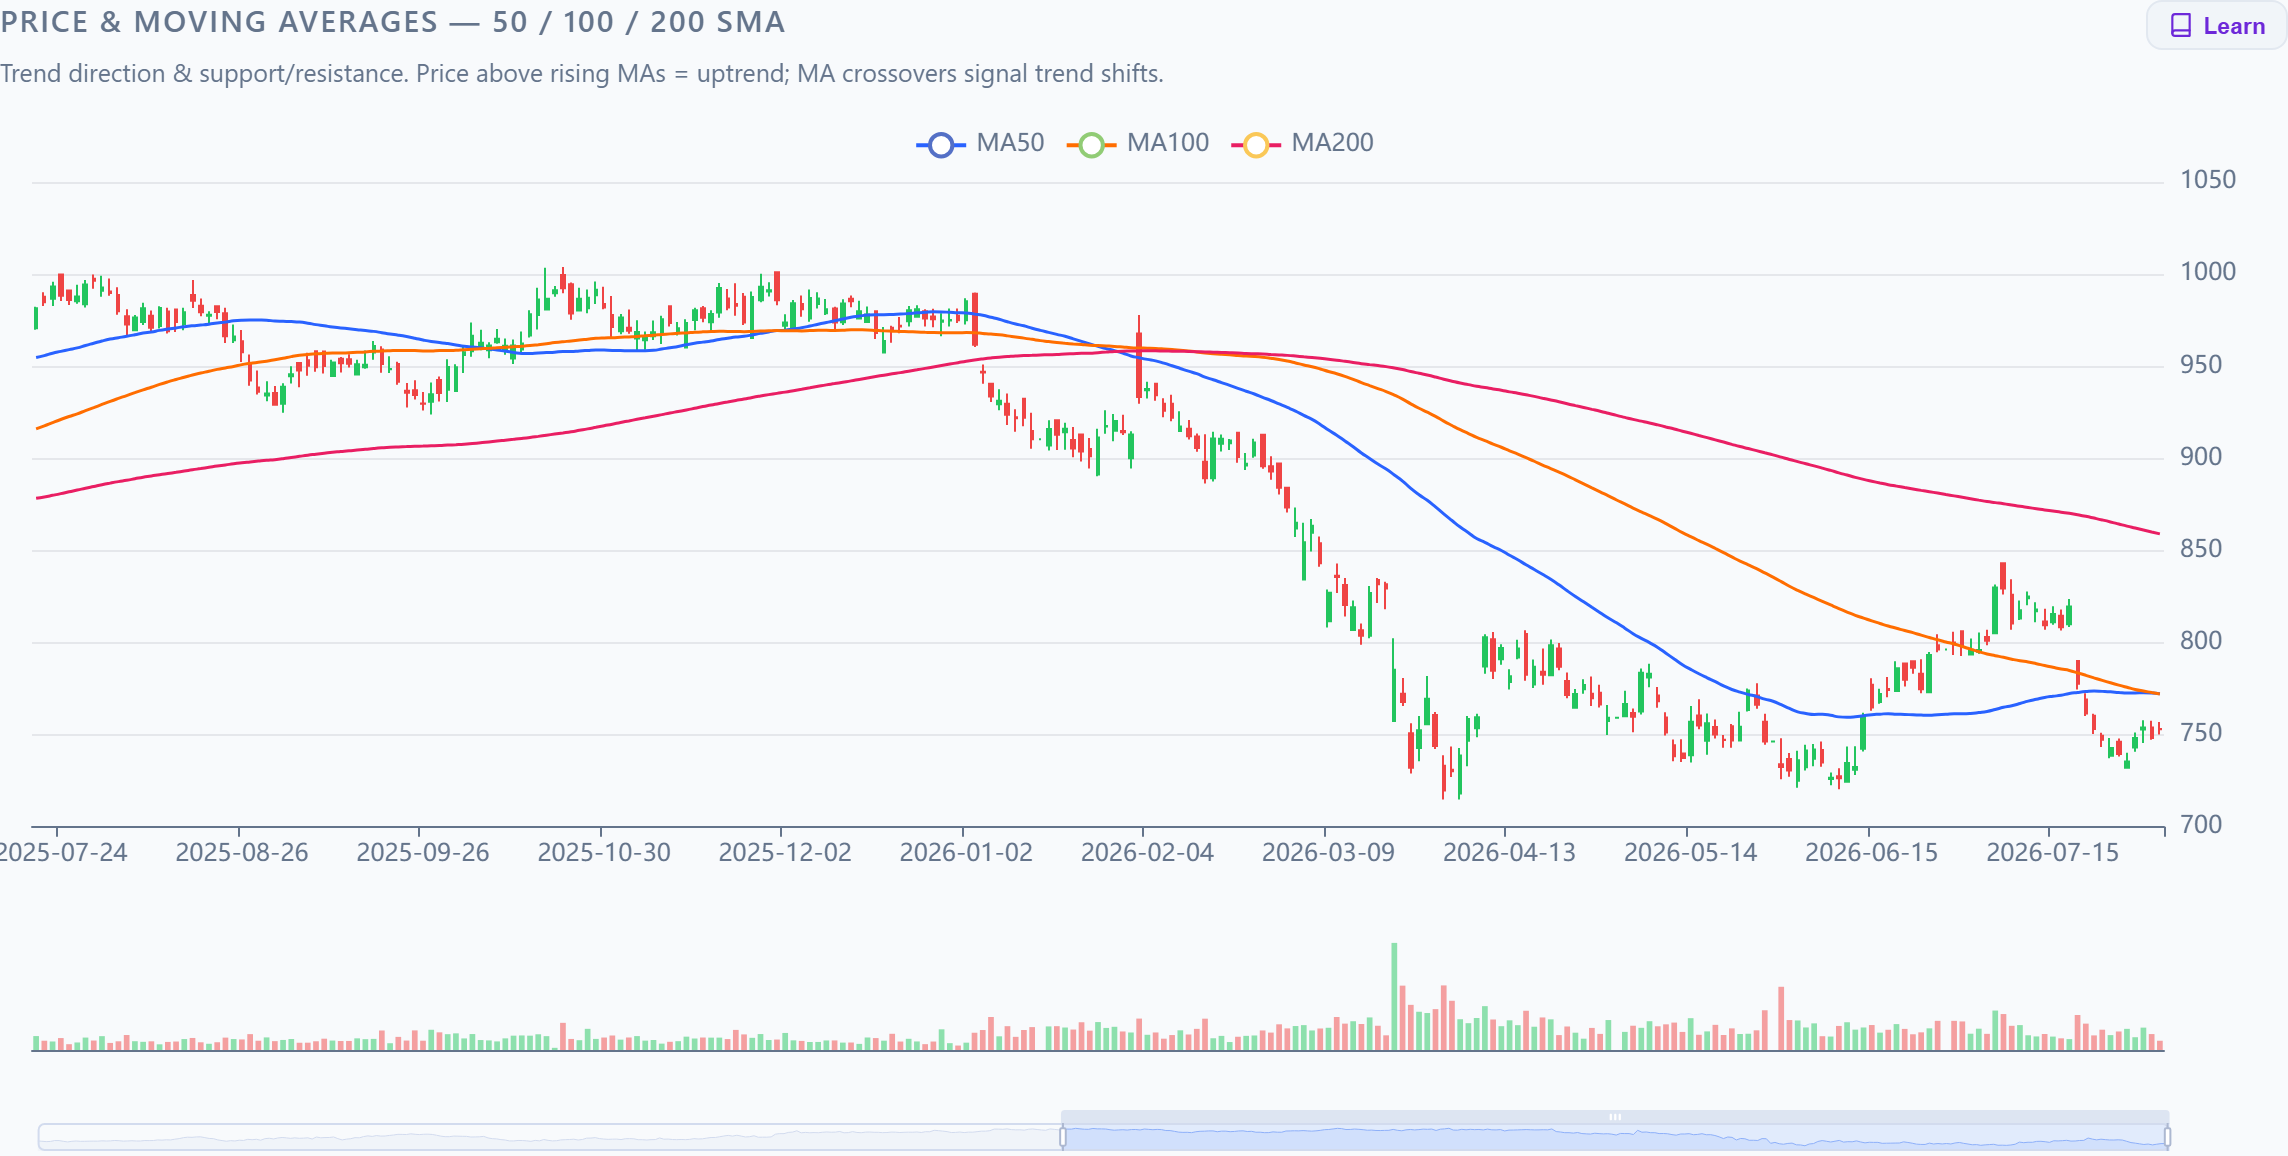
Price & Moving Averages — 50 / 100 / 200 SMA
Trend direction & support/resistance. Price above rising MAs = uptrend; MA crossovers signal trend shifts.
Trend Filter Strategy — Price vs 200-day SMA
The most-watched long-term trend rule: long while price is above its 200-day SMA, in cash below it. Green bands mark the in-trend (long) stretches; ▲/▼ mark the days the filter flips.
EMA Crossover Strategy — 12 / 26
A faster trend-following rule: long while the 12-day EMA is above the 26-day EMA, in cash below. Reacts sooner than the SMA cross. Green bands mark the long stretches; ▲/▼ mark each crossover.
Donchian Breakout Strategy — Turtle 20 / 10
The classic Turtle rule: go long on a break above the prior 20-day high, exit on a break below the prior 10-day low. Green bands mark the in-position stretches; ▲/▼ mark breakouts and exits.
Bollinger Bands — 20-day, 2σ
Volatility envelope. Price tagging the upper/lower band signals stretched moves; band squeeze = low volatility before a breakout.
Deviation from average price. Above +100 = strong upward move, below −100 = strong downward move.
Loading options chain…
Expiration:
Open Interest by Strike — Call vs Put Walls
Standing positions per strike. Large call-OI strikes act as resistance, large put-OI strikes as support. Dashed lines mark spot & max pain.
Volume by Strike — Today's Flow
Contracts traded today per strike. Volume far above open interest flags fresh positioning / unusual activity.
Implied Volatility Skew
IV across strikes for this expiry. A steep put-side skew (higher IV on downside strikes) signals demand for crash protection.
Max Pain
Total in-the-money value owed to option holders at each price. The minimum (max pain) is where most options expire worthless — price often gravitates there into expiry.
Gamma Exposure (GEX) by Strike — Dealer Estimate
Estimated dealer gamma. Positive (green) = dealers dampen moves (pinning); negative (red) = dealers amplify moves. The zero-cross is the gamma-flip level. Rough Black-Scholes estimate.
Put OI ÷ Call OI per expiration. Above 1 leans bearish (often read contrarian-bullish at extremes); below ~0.7 = call-heavy / bullish.
Loading 5 years of price history…
Equity Curve — Strategy vs Buy & Hold
Growth of a notional $10,000 invested at the start of the window. Purple = the selected strategy; dashed grey = simply buying and holding. Past performance does not guarantee future results.
Signal Chart
The indicator that drives this strategy, with the exact ▲ Buy and ▼ Sell points where the backtest opened and closed positions. Zoom / pan with the slider.
Configured strategies
Each strategy is paper-traded forward from the moment you add it. Click one to see its performance and executed trades since then.
Loading price history…
Equity Curve — Strategy vs Buy & Hold (since configured)
Growth of a notional $10,000 invested the day this strategy was configured. Purple = the strategy; dashed grey = buy & hold from the same day.
Signal Chart
The indicator driving this strategy with the ▲ Buy / ▼ Sell points since it was configured.
Trades executed
#
Side
Date
Price
Shares
P&L
AI Insight
Plain-English summaries of the Valuation, Fundamental, Technical and Options charts for this stock. Each summary is stored once written and shown with the date it was generated, so opening this page is free — it is rewritten only when you press Refresh. The earnings call has its own page.
AI-generated from the data on this dashboard. It can be wrong or incomplete — verify before acting. Not investment advice.
Each line is tinted by which way it cuts for the business:▲ Positive — a strength or an improvement▼ Negative — a weakness or a deterioration● Caution — mixed, conditional or worth watching● Neutral — factual, no clear direction
Earnings Call
Pick a quarter to read its source document — a verbatim earnings-call transcript, or the company's SEC filing when no transcript exists — or have it summarized. Each quarter's summary is stored separately and rewritten only when you press Refresh.
AI-generated from the company’s own earnings disclosure. It can be wrong or incomplete — verify before acting. Not investment advice.
Each line is tinted by which way it cuts for the business:▲ Positive — a strength or an improvement▼ Negative — a weakness or a deterioration● Caution — mixed, conditional or worth watching● Neutral — factual, no clear direction
Saved visuals
Chart guide — how each chart works & how to read it
 VroomStocks